
The main idea is to get an executable file from the dump. When I try with WinDbg, there was a problem related to the SDK (even with the last version) and some missing Dll files. It was also some plugins need to be installed. I had some problems with SOS.dll, mscorwks.dll, clr.dll, and psscor4.dll with integration and install.
In this article, I will give you information about taking executable files which are inside dump files. If I talk about our scenario, there is a dump file from svchost.exe that look suspicious. So we’ll load a dump file on WindDbg then we’ll look output. After getting all information, we’ll use Radare to get binaries from the executable file. Lastly, we’ll use IDA Pro to check the binary file.
Why am I using Radare tool?
The main idea is to get an executable file from the dump. When I try with WinDbg, there was a problem related to the SDK (even with the last version) and some missing Dll files. It was also some plugins need to be installed. I had some problems with SOS.dll, mscorwks.dll, clr.dll, and psscor4.dll with integration and install.
When I fixed one of them, it didn’t work other ones. Honestly, it was chaos for me. When I tried to find something related to this, I was tired of looking at the same things. Then I remembered that I tried a Radare tool some while ago. So I decide to use :)
Environment Requirements
1- Virtualization : VirtualBox or others
2- Operating System : Windows7 x86/x64
3- Softwares: Radare, Windbg, IDA Pro
A most important section to be considered WinDbg here. I have published a serie of articles on Windows Kernel Exploitation including Windbg installation and Symbol Path addition. So you can check it.
Let’s start to analyze with Windbg
First, we’ll open WinDbg and then load the dump file.
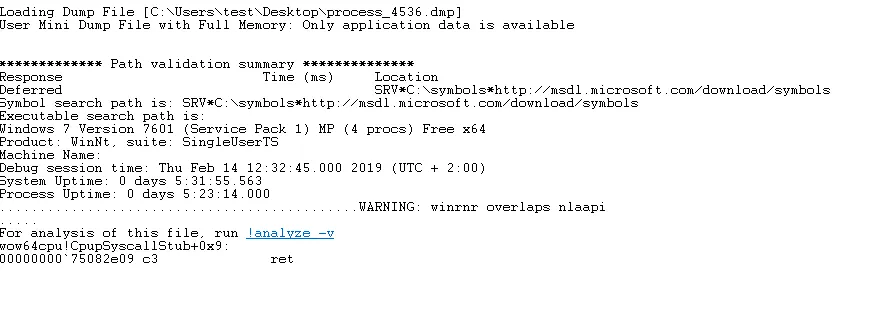
If there are no problems with the loading of Symbol files, it will prompt you to run this file with analyze -v command for analysis. So we can use !analyze -v command to begin.
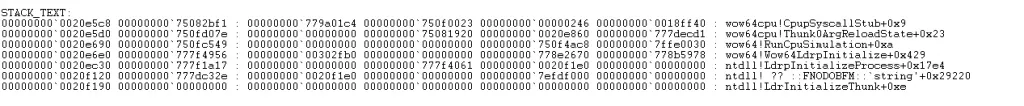
As a result of the analysis in the above section, we’ll see the stack trace output of this dump file. This means that when events in this dump file occur, this indicates which drives are running with this event in the back. Here we see that wow64cpu and ntdll are running during this time.

In the above section, in addition to the stack information, there are also FOLLOWUP_IP outputs. This section provides information about the command executed before the error check.
This section contains the name of the driver that is thought to cause the error. But if I talk about our dump, there was an executable file that is illegal executable under the legal executable file. That’s why we took a dump.
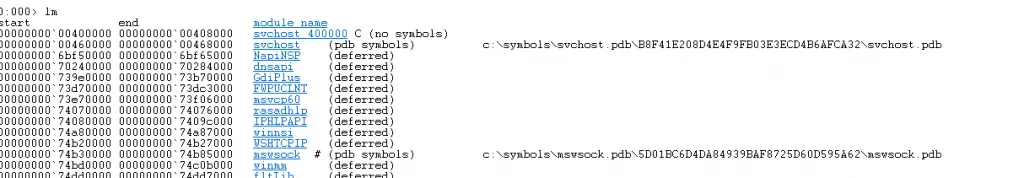
After obtaining the information from the dump file, we can use the lm command to get information about all installed modules.

We can obtain information about the memory used by the target process or the target computer with the address command. These are the blocks of code we are interested in.
MEM_IMAGE: The page is used to store the module(EXE/DLL). It may share the physical storage with other processes because shared DLL is loaded to memory only once and shared by multiple processes.
MEM_PRIVATE: The page is private to this process. It’s not shared.
MEM_COMMIT: The page has been committed. The committed page is associated with physical storage and you can read/write the page.
MEM_FREE: The page is not used.
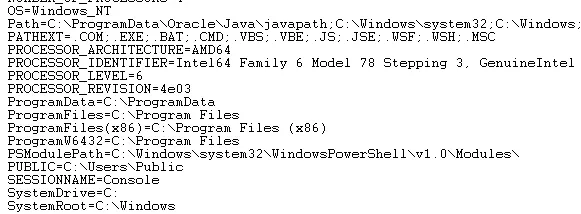
In this step, we’ll use !peb command. When we check the output of this command, we’ll get information about the operating system, architecture of the system, Powershell Module Path, defined pc, user and domain name, etc.
Access binary with Radare
As I mentioned at the beginning of the article, I had difficulty preparing the environment for doing this in WinDbg. That’s why I used radare2 mdmp module.
I installed with brew on the Mac OS that I used as the main host instead of installing it in my Windows environment. Then we use the Carving method to achieve the desired to result. We’ll do extract the executable file contained in the dump file.
First, we’ll open the terminal then we’ll go to the pathway where the dump file is. Then we open it with ‘ r2 filename.dmp command.

At this point, using the iS ~ exe command, we extract the list of our executable files. The reason why two identical exe appear is that there is an illegal exe file with the same name running under a legal exe.
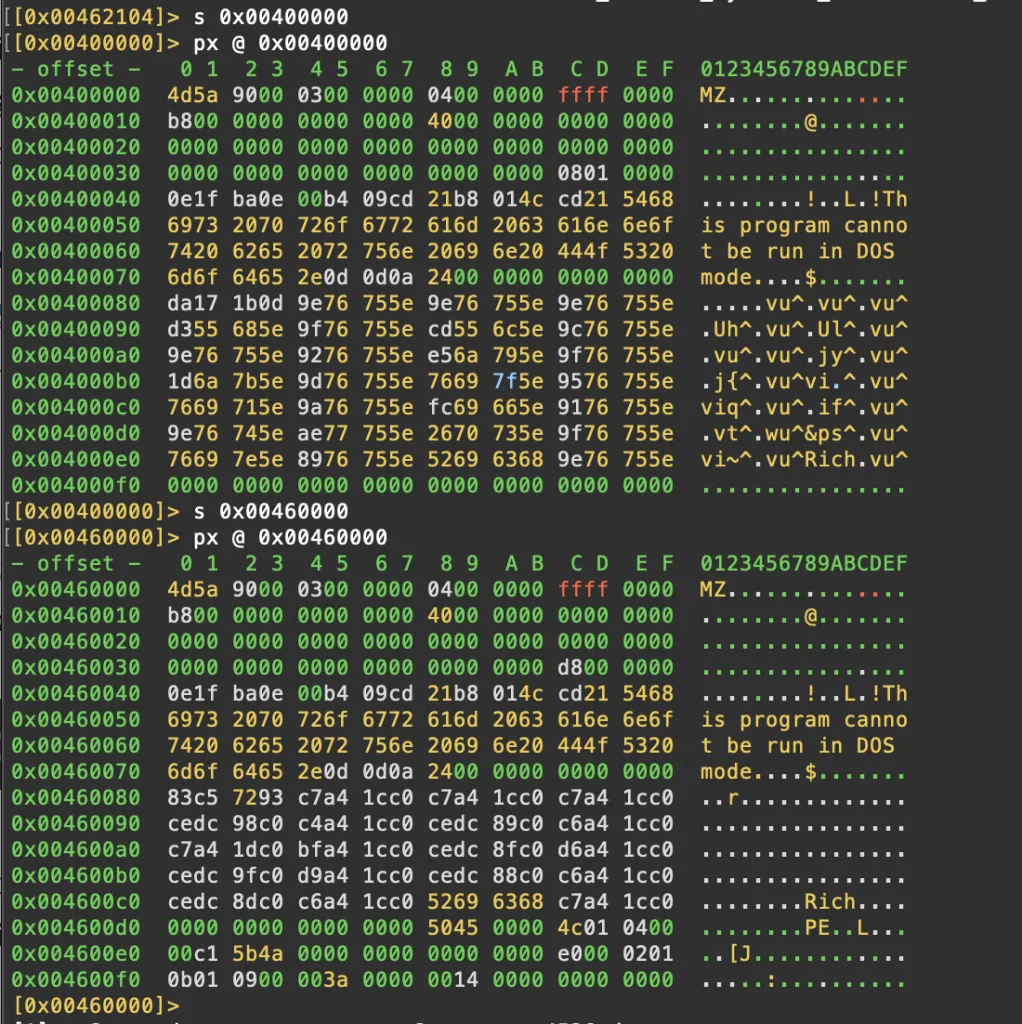
As seen above, we are looking at the binary views of exe files. We can see that the file with the offset value 0x0046000 is more worth reviewing.
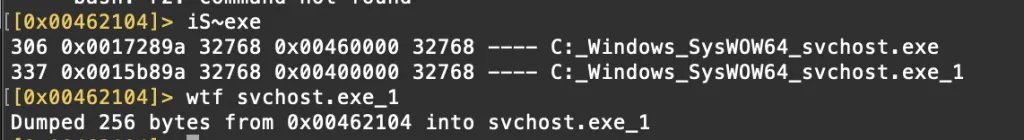
After that, we’ll get as binary with thewtf command. The next step is the review with IDA Pro.
Binary analyzing with IDA Pro
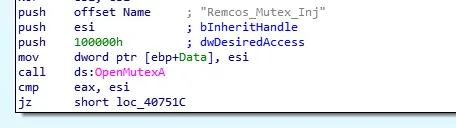
After obtaining the binary file, we’ll load it on IDA Pro. Remcos Mutex Inj is noticed as we begin to examine the resulting graph.
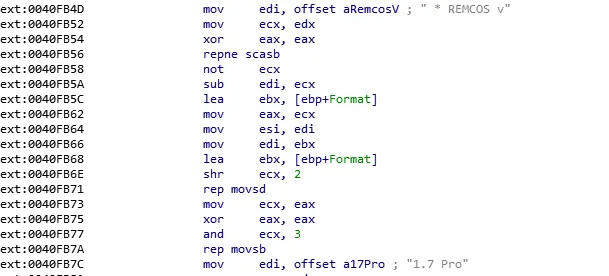
If we do a little more review, we can see that Remcos is RAT Malware.
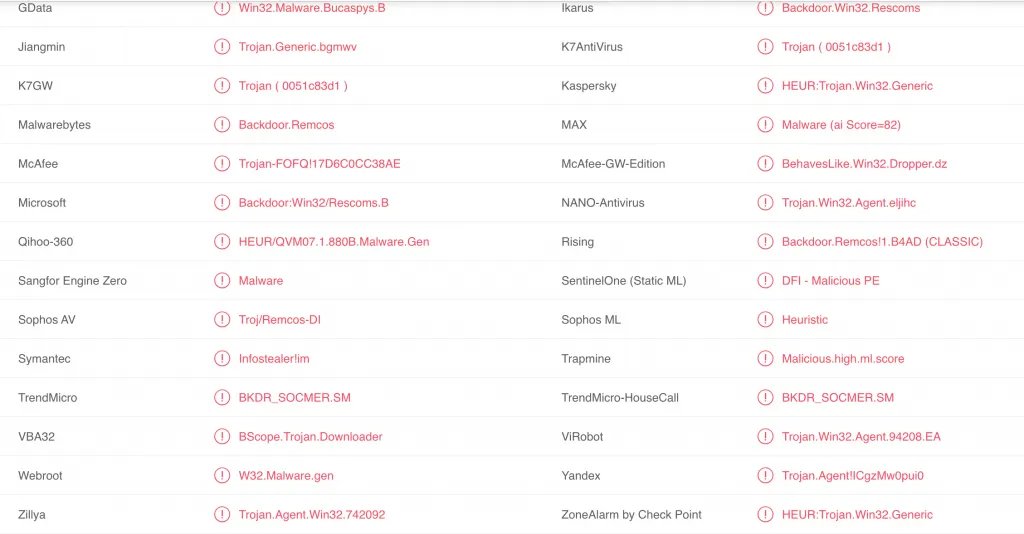
Then we’ll load it on VirusTotal, and the result is above.
SHA-1 : 12eb3c953d8a7af1e34bc87a6ac59bd70c845bb45
References
1- https://radareorg.github.io/blog/posts/minidump/
3- https://docs.microsoft.com/en-us/windows-hardware/drivers/debugger/general-extensions